Dashboards onAnother Level
Driven by AI - giving you the power to fuel results
Live Preview
AI Agents Dashboard
Monitor agent workflows, MCP tool calls, and model performance in real time.
Live Preview
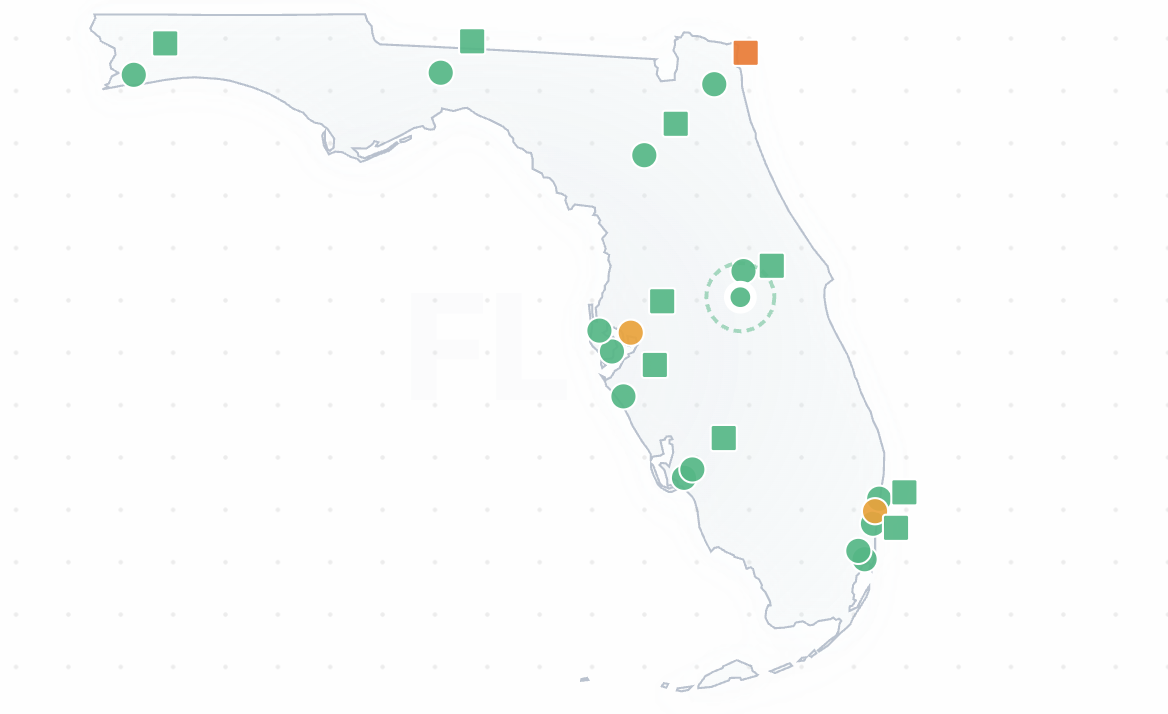
Real-time geo-intelligence
Click any site to stream live energy production data. State-level fleet stats, weather overlays, and per-site output charts update every 2 seconds.
California
34 sites · Hover for details • Click on site to see real-time energy production
Sites (34)
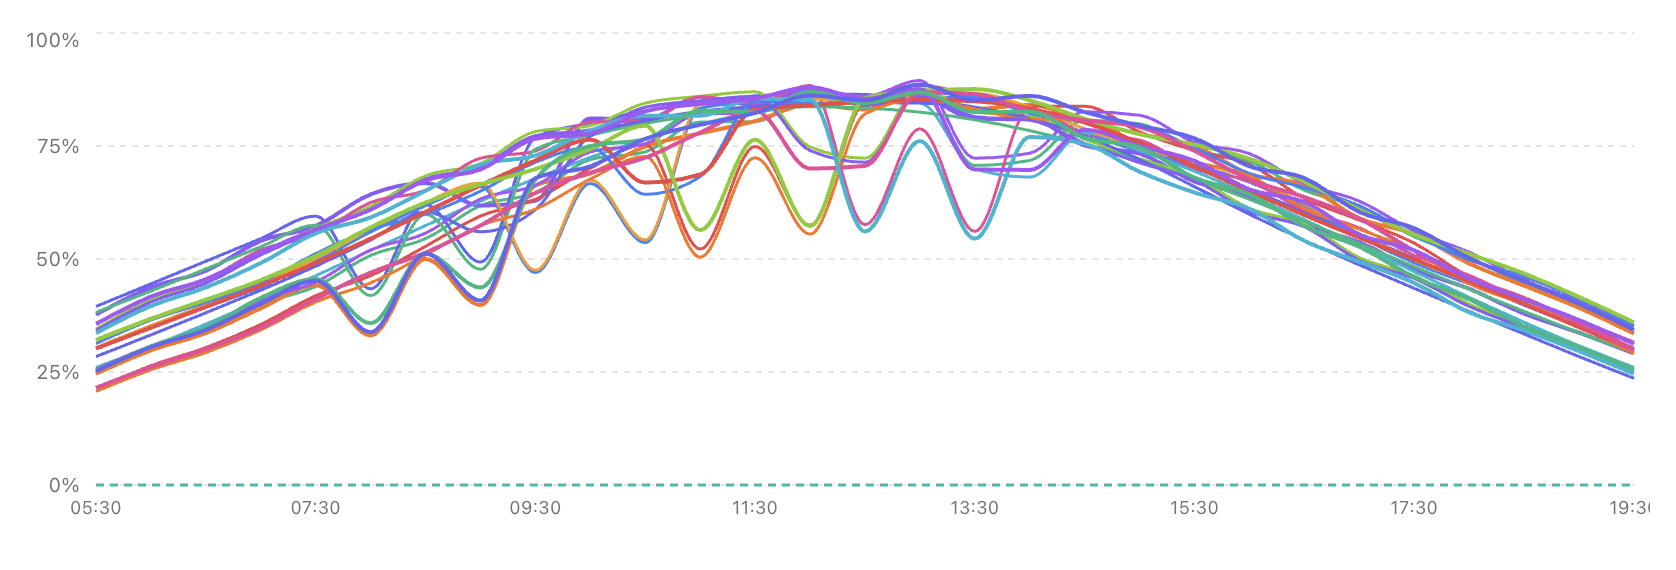
Site Production — CA
Hourly output · % of rated capacity · 32 sites · hover to update distribution below
Patel Residence
9.6 kW · Los Angeles
Jensen Home
7.2 kW · San Diego
Martinez House
10.8 kW · Sacramento
Wong Residence
8 kW · San Jose
Nakamura Home
11.2 kW · Fresno
SunMart Retail Center
120 kW · Los Angeles
TechHub Office Park
245 kW · San Jose
Fresno Agri-Storage
180 kW · Fresno
Torres Residence
8.8 kW · Long Beach
Kim Home
9.6 kW · Irvine
Rivera House
10.4 kW · Riverside
Thompson Residence
12 kW · Bakersfield
Nguyen Home
8 kW · Anaheim
Scott Residence
10.8 kW · Stockton
Lewis House
7.6 kW · Santa Barbara
Clark Residence
13.2 kW · Palm Springs
Walker Home
9.2 kW · Modesto
Allen House
8.4 kW · Chula Vista
Harris Residence
11.6 kW · San Bernardino
Robinson Home
9 kW · Oxnard
White Residence
10 kW · Fontana
Young House
7.2 kW · Oakland
Adams Residence
8.8 kW · Pasadena
Nelson Home
9.6 kW · Santa Ana
Riverside Distribution Ctr
185 kW · Riverside
Long Beach Port Solar
380 kW · Long Beach
Sacramento Medical Campus
150 kW · Sacramento
San Diego Convention Ctr
320 kW · San Diego
Palm Springs Resort Solar
140 kW · Palm Springs
Bakersfield Agri-Complex
260 kW · Bakersfield
Anaheim Entertainment Hub
195 kW · Anaheim
Stockton Warehouse Park
145 kW · Stockton
Output Distribution
Site output histogram at 12:00 · moves with cursor
Mean (μ)
76.3%
Std Dev (σ)
26.6%
±1σ range
50–100%
Sites
32
Industries
Built For Your Industry
Each dashboard is purpose-built with domain KPIs, industry-standard metrics, and AI models trained on sector-specific data.

AI Agent Console
Manage & Monitor your agents

Logistics
Fleet to warehouse
Energy
Grid-scale intelligence
Solar
AI-driven performance
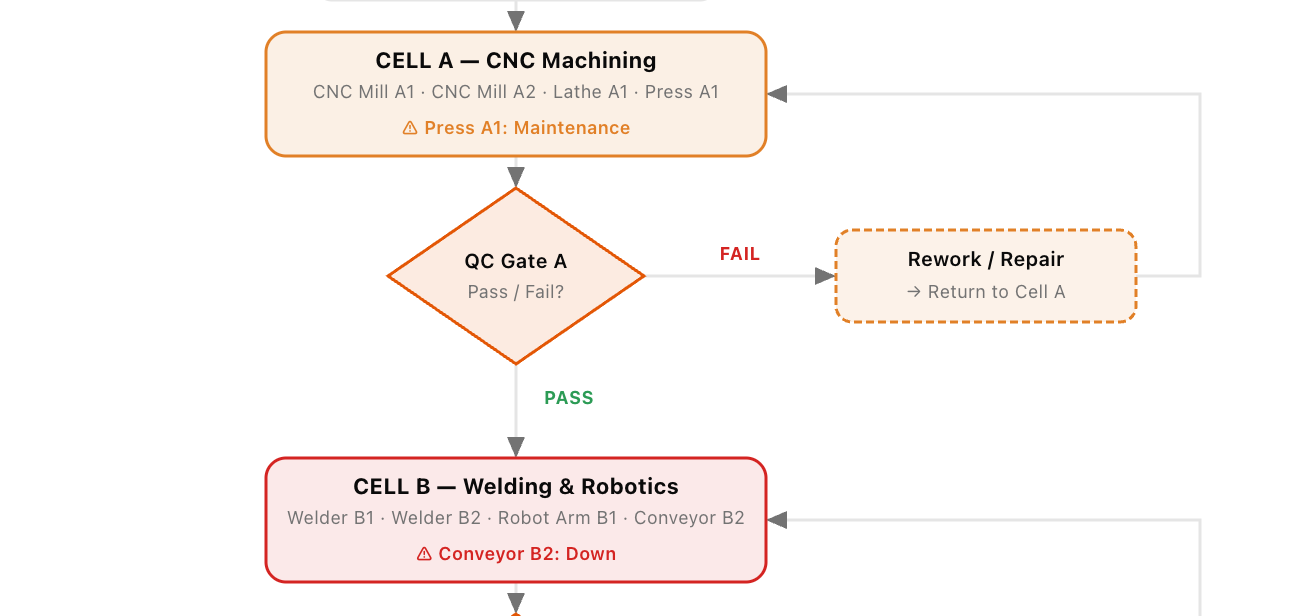
Manufacturing
OEE Automated
Customer Experience
End-to-end CX intelligence
Platform
What sets us apart
Every dashboard ships with the same battle-tested core — real-time ingestion, AI prediction engines, and a visualization layer that handles any data shape.
AI-Powered Insights
ML models surface anomalies, predict equipment failures, and forecast output before problems appear on the floor.
Real-Time Streaming
Sub-second data refresh with live charts, animated KPIs, and alert feeds that update as events happen.
Deep Visualizations
Heatmaps, correlation matrices, SVG treemaps, candlestick charts, and 3D surfaces — all rendered in the browser.
Enterprise Grade
Role-based access control, audit trails, SSO integration, and SOC 2-aligned data handling for regulated industries.
Historical Playback
Drill into any time range with interactive zoom, period-over-period comparison, and one-click CSV / PDF export.
Modular Architecture
Pick only the modules your operation needs. Dashboards are composable and deploy independently per site or team.
Intelligence built into every metric
Our AI layer doesn't just visualise history — it predicts what's next. Anomaly detection flags deviations the moment they occur. Forecasting models trained on your historical data surface the insights your operators need before they know to ask.
AI Requirements Gathering
Completely automated error detection, correction, validation, and imputation of missing values
Automatically parse calls, Slack threads, emails, documents, and datasheets into structured engineering requirements — with full traceability back to the source.
48
Sources processed
127
Requirements extracted
14
Pending review
89
Linked to design items
Call
28
requirements
9 sources processed
Slack
11
requirements
14 sources processed
34
requirements
11 sources processed
Document
42
requirements
8 sources processed
Datasheet
12
requirements
6 sources processed
ID | Title | From / Channel | Participants | Date | Meta | Reqs | ||
|---|---|---|---|---|---|---|---|---|
| SRC-031 | Call | Customer requirements review — Apr 18 | M. Okafor (Acme Systems) | D. Sullivan, J. Park, M. Okafor, T. Reeves | Apr 18 · 14:30 | 45 min | 4 | processed |
| SRC-030 | Call | Systems architecture review — Apr 20 | Internal — Systems team | J. Park, L. Huang, R. Osei, K. Patel | Apr 20 · 10:00 | 60 min | 3 | processed |
| SRC-029 | Call | Supplier qualification kickoff — Apr 16 | A. Garcia (Acme Procurement) | A. Garcia, S. Nguyen, D. Sullivan | Apr 16 · 09:00 | 30 min | 2 | processed |
| SRC-028 | Slack | #hw-systems — connector ICD discussion | #hw-systems | — | Apr 19 · 09:14 | 14 replies | 1 | processed |
| SRC-027 | Slack | #procurement — voltage regulator lead time | #procurement | — | Apr 21 · 11:40 | 8 replies | 0 | processed |
| SRC-026 | Slack | #firmware-dev — CAN FD baud rate decision | #firmware-dev | — | Apr 22 · 14:05 | 22 replies | 2 | processing |
| SRC-025 | Email | Re: IPC workmanship standard — supplier qualification | procurement@acme-systems.com | — | Apr 17 · 08:52 | 1 attachment | 2 | processed |
| SRC-024 | Email | RFQ Rev 4 — updated voltage and environmental specs | engineering@acme-systems.com | — | Apr 15 · 16:20 | 3 attachments | 3 | processed |
| SRC-023 | Email | EMC test scope amendment — contract addendum | contracts@acme-systems.com | — | Apr 13 · 10:30 | 2 attachments | 2 | processed |
| SRC-022 | Document | Interface Control Document — ICD-004 Rev B | Systems Engineering | — | Apr 14 | 28 pages | 5 | processed |
| SRC-021 | Document | RFQ document — Apr 15 Rev 4 | Acme Systems | — | Apr 15 | 34 pages | 12 | processed |
| SRC-020 | Document | Reliability requirements — MTBF and warranty targets | Acme Systems Engineering | — | Apr 11 | 12 pages | 4 | processed |
| SRC-019 | Datasheet | Acme Power Module — Component Datasheet Rev C | Acme Components Library | — | Apr 12 | 48 pages | 3 | processed |
| SRC-018 | Datasheet | CAN FD Transceiver — NXP TJA1044 | NXP Semiconductors | — | Apr 10 | 62 pages | 2 | processed |
| SRC-017 | Datasheet | Automotive-grade MCU — STM32H7 Series | STMicroelectronics | — | Apr 8 | 214 pages | 3 | queued |
Start with the dashboard your team needs today
Pick your industry and leap frog ahead with
the most intelligent dashboards available today